Overview
There’s a saying in software testing: catching a bug in development cost 1c, catching it in testing costs $10 and catching it in production costs $10,000. It’s critical that you catch bugs as early as possible, before they cripple your software. Today at CodeClouds, we’re hunting bugs.

The average lifespan of a piece of software is between nine and ten years. Web applications, however, have a rather short lifespan of approximately three years, unless there is an upgrade to revitalise them.
There are several reasons for this phenomenon: the advent of newer and faster technologies, platforms, frameworks, languages, tools etc. but above all, less than optimum performance is the reason for the short lifespan of web applications—an application that runs poorly isn’t going to last as long.
Clients also intend to implement cutting edge technology including Intelligent Systems, Analytical Systems, Business Intelligence Systems etc as upgrades of slow outdated systems. Our objective is to increase the lifespan of web applications that are undergoing development, to create value for money from a client perspective and—in turn—for us as an IT services provider.
Anyone with a sound knowledge of web development will have encountered a very common issue with applications called a performance bottleneck. A bottleneck is a particular component that is slowing down everything else. Discovering and removing bottlenecks is a key component of performance testing. Not only will it make the software run more smoothly, it can extend its lifespan by years!
Complexities can arise both in relation to data and applications. Moreover, with the evolution and transformation of business logic and requirements over time, an application may not be able to cope—if it was designed for a particular goal in 2012, it won’t be suited for a modified goal in 2015.
Beating them to the punch: some thoughts on optimization
The best protection is prevention: well-written and properly deployed code has fewer bugs. Some solutions available to us include: opcode caching, file caching, database query caching, query optimization, database optimization, upgrading to a lightweight and faster-performing front end JS library, minifying scripts and stylesheets, upgrading hardware, moving to a cloud based environment, and migrating to a big data platform. With so many implementation options to choose from, our decision is going to vary a lot depending on the particulars of your software.
Performance enhancement is a never-ending process and is far more effective if it is proactive rather than reactive. Ideally, performance tuning and optimization should occur from the outset, and should occur at the code level first.
To do this, we need a tool known as Code Profiler to measure performance.. Profiling is about measuring the relative performance of applications at the code level. Profiling tells us the CPU usage, memory usage, time complexity, number and duration of calls per function, and creates a call graph or a call stack.
Active and Passive Profilers
A code profiler is a useful tool for the analysis of code in relation to bottlenecks, or for generally identify the sections of code that are slow and could use a speed boost. Broadly, there are two types of profilers: active and passive. Active profilers are used during the development of the applications. They gather more data than is required, are low on performance and should not be used in production environments.
Xdebug, for example, is an active profiler that has been in the market for quite some time now. Passive profilers on the other hand are used for production environments as they have minimal effect on performance, but they gather sufficient information to diagnose the performance bottlenecks and resolve them. Xhprof, Xhgui, Linko, Blackfire, New Relic etc are passive profilers. We’d be here all day if we talked about every program on the market, so today we’re sticking with Xdebug.
Features:
- Displays stack traces on error conditions, maximum nesting level protection and time tracking.
- Replaces the PHP’s var_dump functions to a more informative variable display.
- Can log all function calls including parameters and return values to a file in different formats.
- Code coverage tells us which lines of script (or set of scripts) have been executed during a request.
- Helps find bottlenecks in our script and visualize those.
- Xdebug provides an interface for debugger clients that interact with running PHP scripts.
Installation:
- Run the
PHPinfo(); - Copy the information from the browser. (Not the source code)
- Paste it in the box at http://www.xdebug.org/wizard.php and click the button with the caption “Analyse my PHPinfo() output”
- Follow the installation instructions, specifying which file to download, where to keep it, how to set up the php.ini in order to get it up and running.
It’s the PHP extension in general and the Zend extension in particular that needs to be installed. The path has to be mentioned in the php.ini file like
zend_extension="/usr/local/php/modules/xdebug.so".After installing, restarting the webserver, then going back to phpinfo, it should show xdebug as a module, which is a confirmation that the installation was successful.
Note: Xdebug is not compatible with the Zend Optimizer module or any other extension that deals with PHP’s internals (DBG, APD, ioncube etc). It should strictly be used in the development environment.
There are quite a few INI settings and PHP functions, through which time traces, track traces, memory usage, the formatted output for var_dump etc. can be obtained. As far as profiling settings are concerned, the profiler in Xdebug outputs profiling information in the form of cache grind compatible files. Various applications can be used to read these cachegrind files for example: KCacheGrind on Linux, QCacheGrind on Mac and Windows, WinCacheGrind on Windows, or by using a web-based solution like Webgrind.

INI Settings:
- xdebug.profiler_append = 0 (default 0: individual files, 1: appended to the same file)
- xdebug.profiler_enable = 0 (default 0: profiling disabled, 1: starts profiling)
- xdebug.profiler_enable_trigger (default 0: selective profiling off, 1: selective profiling on and only profiles for a request. When this setting is set to 1, we can trigger the generation of profiler files by using the XDEBUG_PROFILE GET/POST parameter, or set a cookie with the name XDEBUG_PROFILE. ex. url? XDEBUG_PROFILE will run profiling for this page only, we should set xdebug.profiler_enable = 0 if we do not want profiling for all the requests.)
- xdebug.profiler_enable_trigger_value = “” (default: “” set a key value to refer to in post/get or cookies to start profiling)
- xdebug.profiler_output_dir = /tmp (specifies where to store the profiling files)
- xdebug.profiler_output_name = cachegrind.out.%p (Stores the format for file names.)
With an appropriate environment for profiling, the cachegrind files are generated and stored in /tmp folder, using any of the applications mentioned above. These files can be opened for profiling. The examples in the article are from QcacheGrind.
Visualization 1: Output from a cache grind file.
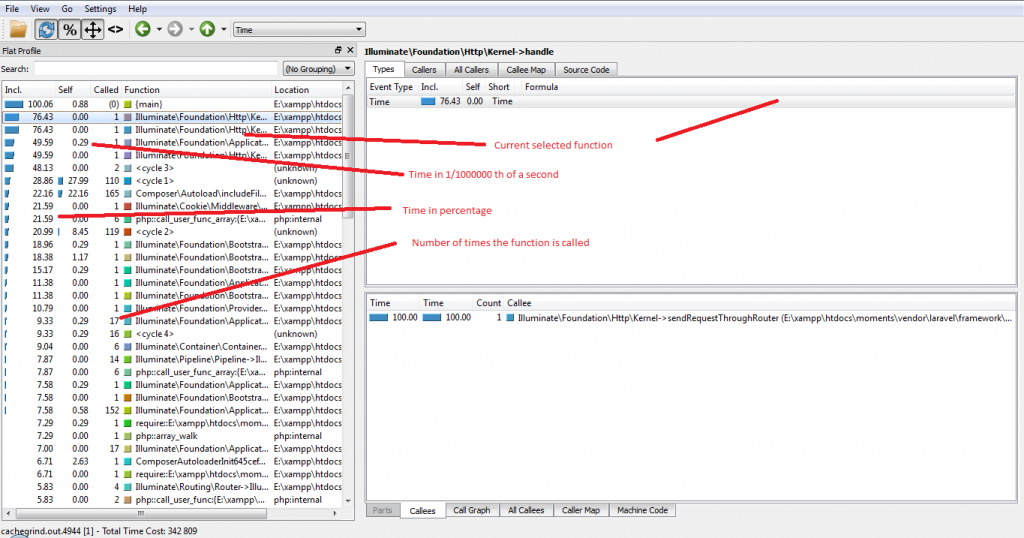
Function calling time in percentage, the number of call repetition, and the call resource file path.
Visualization 2: Caller / Callee
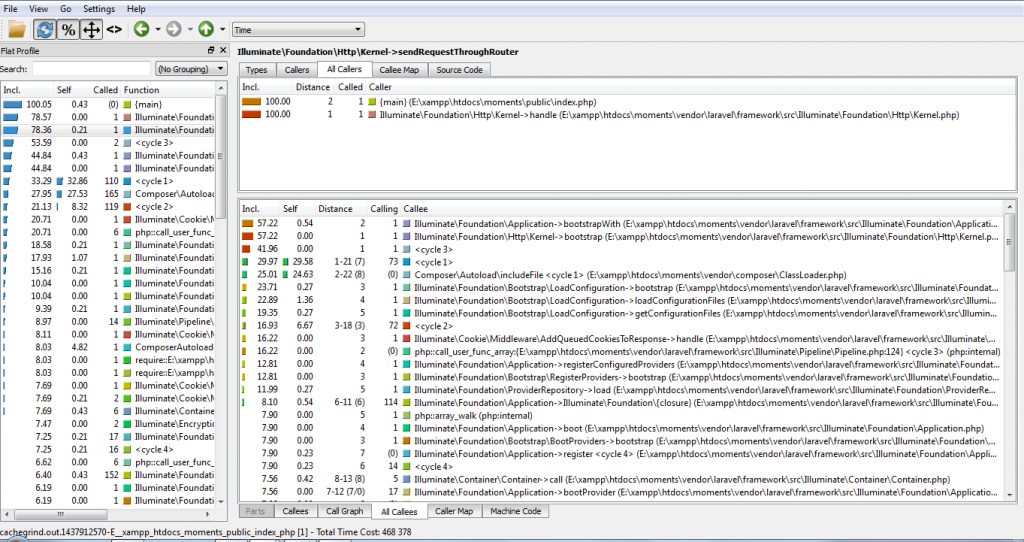
Overall view of caller and callee and timeline of the executed script.
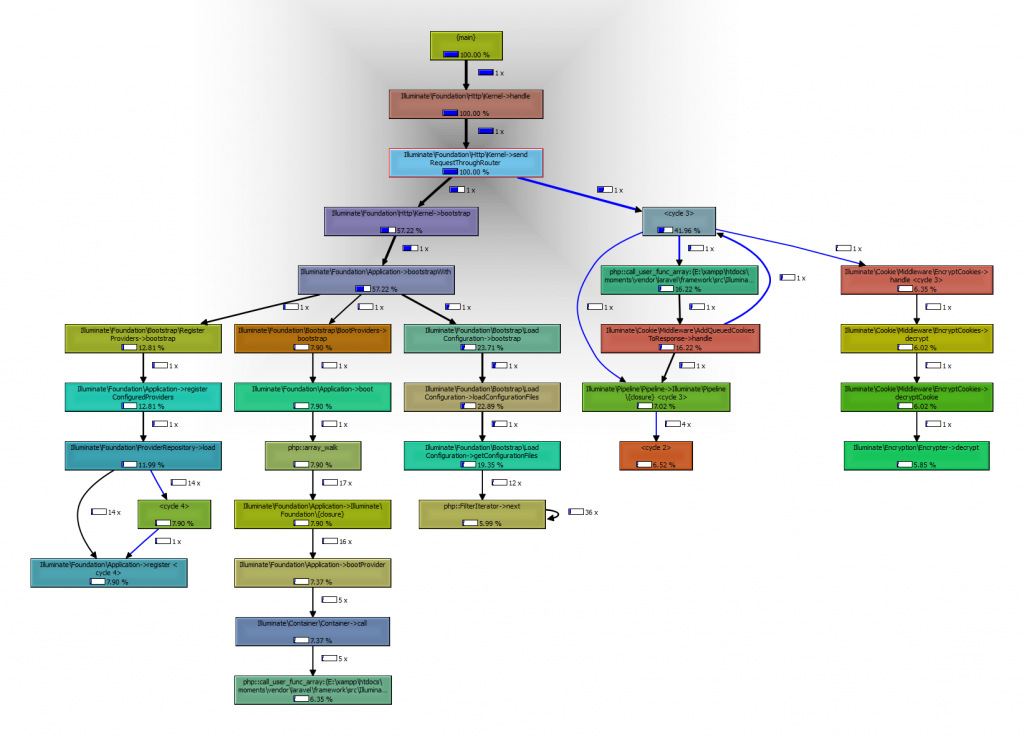
Visualization 3: Call Graph
If you’re a PHP developer looking to take your code to the next level, check out our blog on PHP performance optimization. If you like the cut of our jib, why not come work with us? We have PHP jobs in Kolkata available, sales jobs in Fort Wayne IN and opportunities for designers in Wellington NZ.
Similar Reads
How can we help?
Tell us about your inquiry and we’ll get back to you as soon as we can.